 Kyle Keough
As a final project for my data visualization course during my time
in my masters program, the task was to create a
webpage with Plotly Dash to display some form of a graphic. The framing
of the assignment was intended to be broad, and how I ran with it was
making an interactive data visualization tool rather
than produce one visualization and format it on a site. By this I mean
that I took a comprehensive assortment of historical baseball data by
individual player, team, and league and allowed the user to dynamically
view whatever stats or scope they were interested. A quick demonstration
of what the site looks like and how it operates is linked below, but I'll
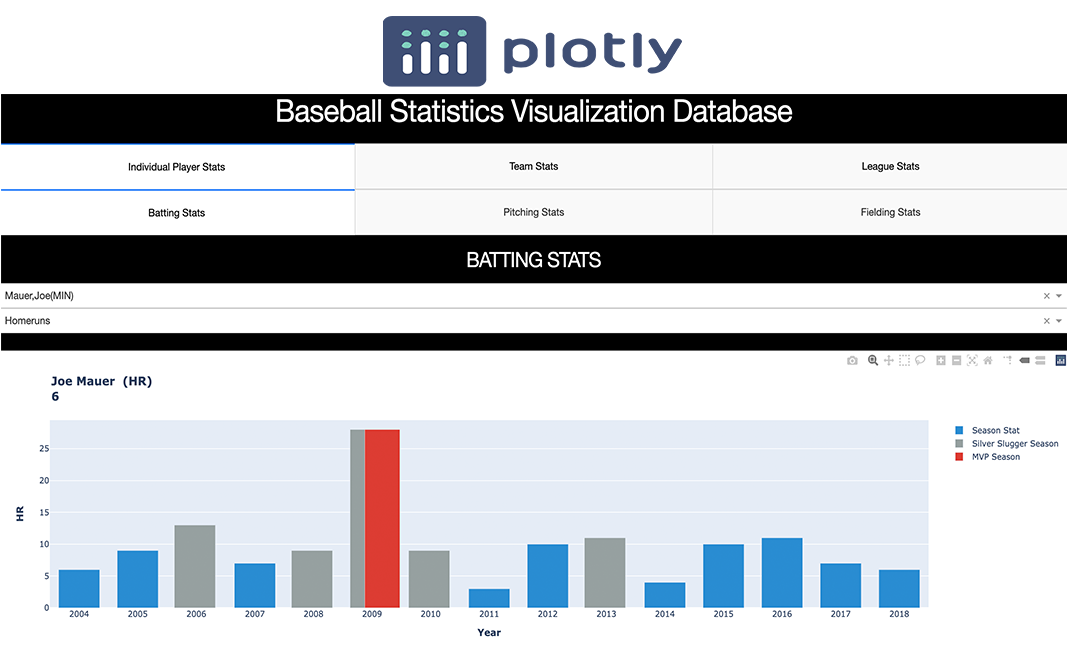
give a quick run down. So the site operates on a tab hierarchy, so for
any of the top 3 tabs your page is currently on (player, team, or league),
any of the lower 3 tabs (batting stats, pitching stats, or fielding
stats) can be visualized. Legends find themselves on the bottom of each
page explaining what any asterisks or numbers next to titles represent.
The graphs also have color coordination based on if the selected player
had won any awards in that given season.
Some hiccups I ran into with this project were first of all the huge
amount of players that have played the game since the 1900 threshold I
set for the year. This caused some latency issues which you will
notice in the video below when I switch between statistic categories
(from batting to pitching) for individual players. Ultimately this
did not prove to be a major issue, and this issue did not affect
any of the site's latency outside of individual players, but it is
something I could address if this site was to move to more of a
production setting. I could add another dropdown to break up the
players alphabetically (i.e. A-D, E-G, etc. for last names) if I was
to stick with Dash. However, given production standards I would move
this project to a different framework where I could cache and
store the data differently. In hindsight the code could have been more
modular, this partly being due to limitations in Dash's syntax and
partly due to naivety on my part at the time I had coded it, so this
could also be addressed if I were to go back and refactor this project.